Discworld Usage
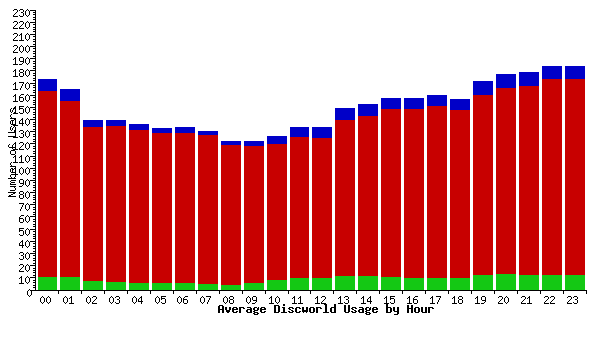
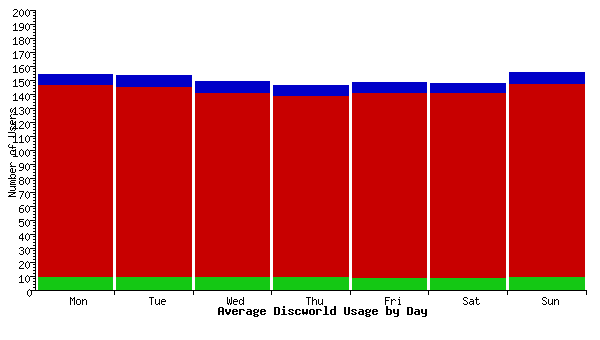
These two graphs show the average usage on each day of the week and the average usage at each hour of the day. These data are collected over each month.
The graphs are updated hourly from samples taken once per hour. They are produced using a Perl script and Thomas Boutell's GD library.
Key: Green indicates creators, red players and blue total.
Average Usage by Hour

Average Usage by Day

